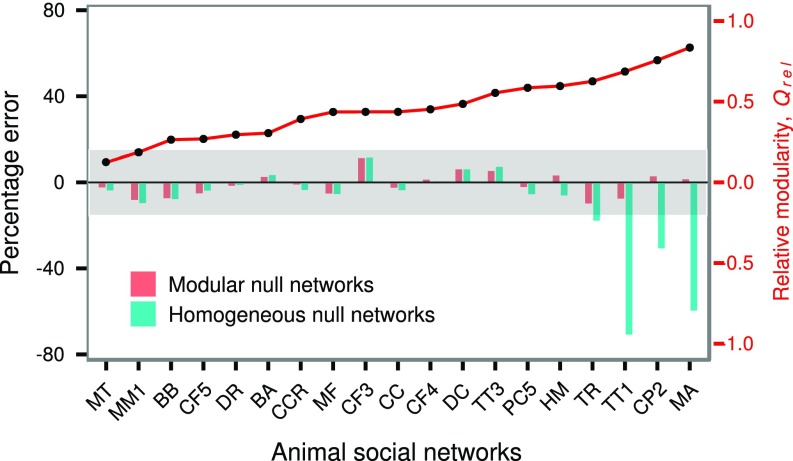
Fig. 5.
Percentage error in outbreak size predictions using modular and homogeneous null networks for 19 animal social networks due to an outbreak with . Percentage error is calculated as , where S = outbreak size, = empirical network, and are modular or homogeneous null networks of the empirical network. The social networks are ordered according to the increasing value of relative modularity (red solid curve, secondary y axis). The shaded region indicates the range of percentage error values <. BA, Brachyteles arachnoides; BB, Bison bison; CC, Cercopithecus campbelli; CCR, Crocuta crocuta; CF, C. fellah; CP, C. pennsylvanicus; DC, dairy cattle; DR, Desmodus rotundus; HM, Haemorhous mexicanus; MA, M. angustirostris; MF, Macaca fuscata; MM, Macaca mulatta; MT, Macaca tonkeana; PC, Papio cynocephalus; TR, T. rugosa; TT, T. truncates. Numbers denote separate groups of the same species.

