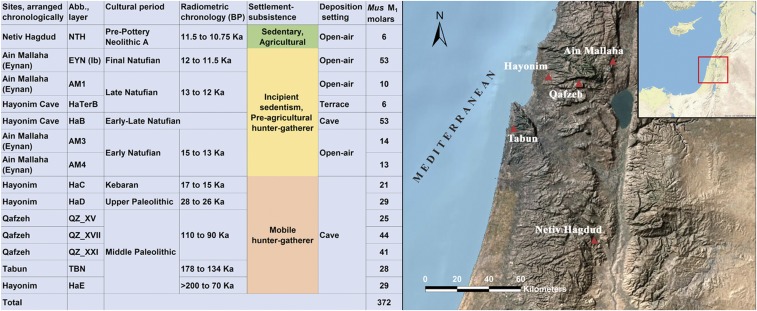
Fig. 1.
Chronology (Left) and location (Right) of the archaeological contexts providing Mus zooarchaeological samples used in this study. Sizes of Mus M1 samples are given in the last column of the table. The base map was generated from Environmental Systems Research Institute (ESRI) map data using ArcGIS v.9.1; Esri, GEBCO, DeLorme, NaturalVue, United States Geological Survey, NASA, Esri Inc.

