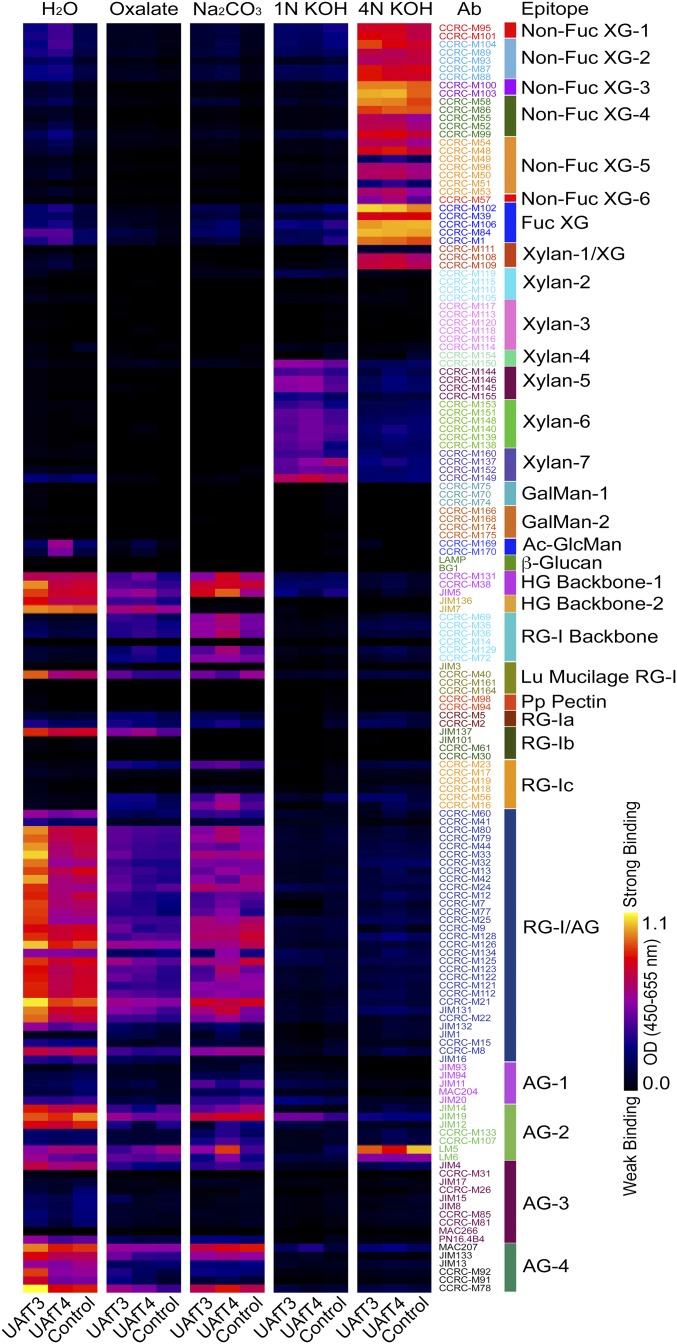
Fig. 4.
Glycome profiling. Sequentially extracted cell wall material derived from plants overexpressing UAfT3, UAfT4, and control plants was subjected to glycome profiling using 155 plant cell wall glycan-directed monoclonal antibodies. A black–yellow scale indicates signal intensity in the ELISA, with black corresponding to no binding and yellow to strongest binding. Labels at the Top specify the different reagents used to extract the cell wall material.

