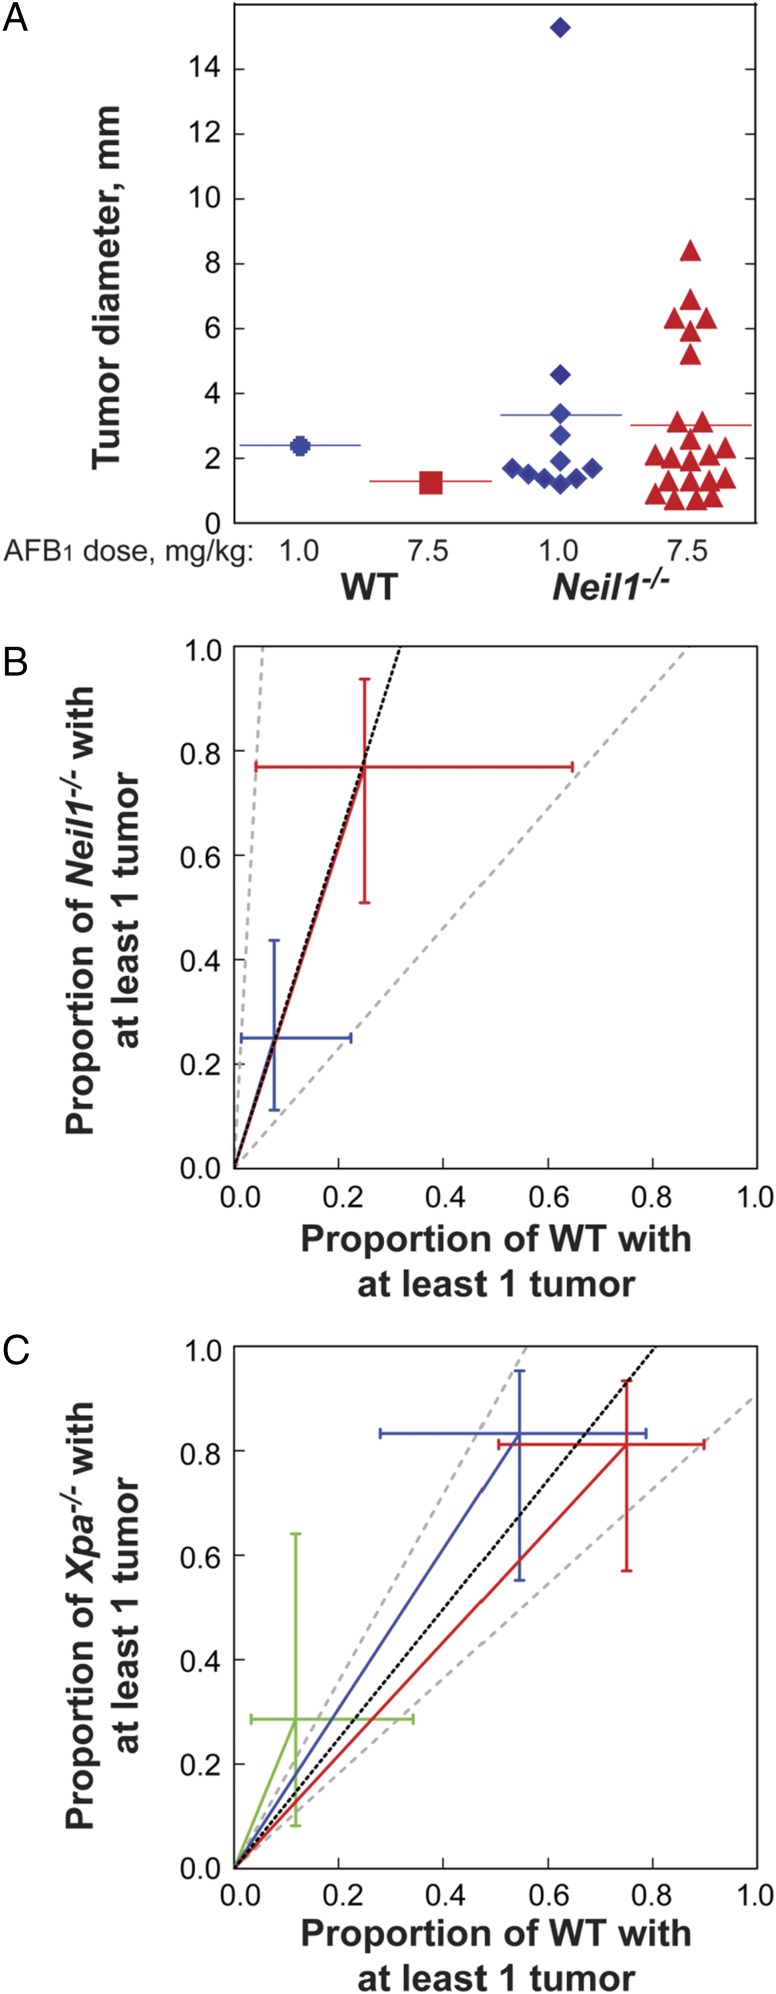
Fig. 4.
AFB1-induced carcinogenesis in Neil1−/− and XPA−/− mice. (A) The individual diameter of liver tumors observed in AFB1-injected WT and Neil1−/− mice. Relative AFB1-induced tumor risk analysis in (B) Neil1−/− mice, with data illustrated by blue and red symbols representing AFB1 doses of 1.0 and 7.5 mg/kg respectively, and (C) XPA−/− mice, with data illustrated by green, blue, and red symbols representing AFB1 doses of 0, 0.6, and 1.5 mg/kg, respectively.

