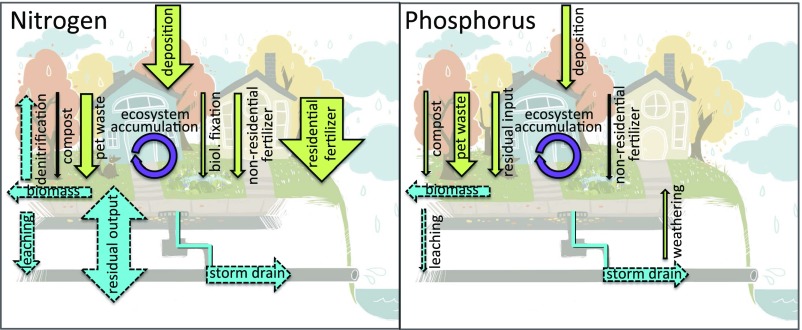
Fig. 4.
Conceptual figure showing watershed area-weighted inputs (green, solid line), outputs (blue, dashed line), and accumulation (purple, solid line) of N (Left) and P (Right). Arrow thickness is proportional to flux (kg of N or P per km2⋅y1, N fluxes = 10× P fluxes). Residual fluxes represent the difference between inputs and accumulation + outputs. Residual P flux indicates unmeasured inputs or depletion of soil P stocks (inputs < accumulation + outputs); residual N flux indicates unmeasured outputs (inputs > accumulation + outputs). “Biomass” includes street sweepings and exported household leaf litter and grass clippings. Details are provided in SI Appendix, Table S12.

