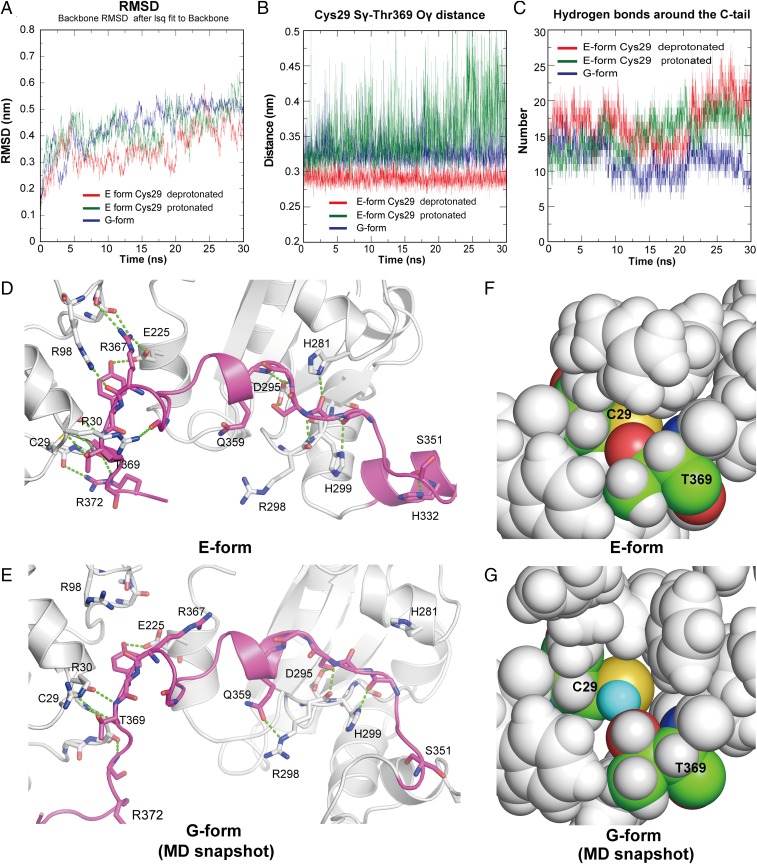
Fig. 4.
pH-sensitive dynamics of the C tail. (A) Root-mean-square deviation plots of the backbone atoms (N, Cα, and C) from the energy-minimized starting structures. (B) Distances between the Sγ of Cys29 and the Oγ of Thr369 during the MD simulations. (C) Number of hydrogen bonds between the C tail (residues 350 to 378) and the a and b′ domains (residues 10 to 340) during the MD simulations. (D and E) Hydrogen bonds around the C tail in the crystal structure of the E form (D) and those in a snapshot of the MD simulation of the G form (E) are represented by green dashed lines. (F) Close-up view around Cys29 (shown in sphere representation) in the initial structure of the E form with Cys29 modeled as the deprotonated state. All atoms except Cys29 and Thr369 are colored in gray. The carbon, oxygen, nitrogen, and sulfur atoms of Cys29 and Thr369 are colored green, blue, red, and yellow, respectively. (G) Close-up view around Cys29 from an MD simulation snapshot of the G form. The Hγ of Cys29 is colored cyan.

