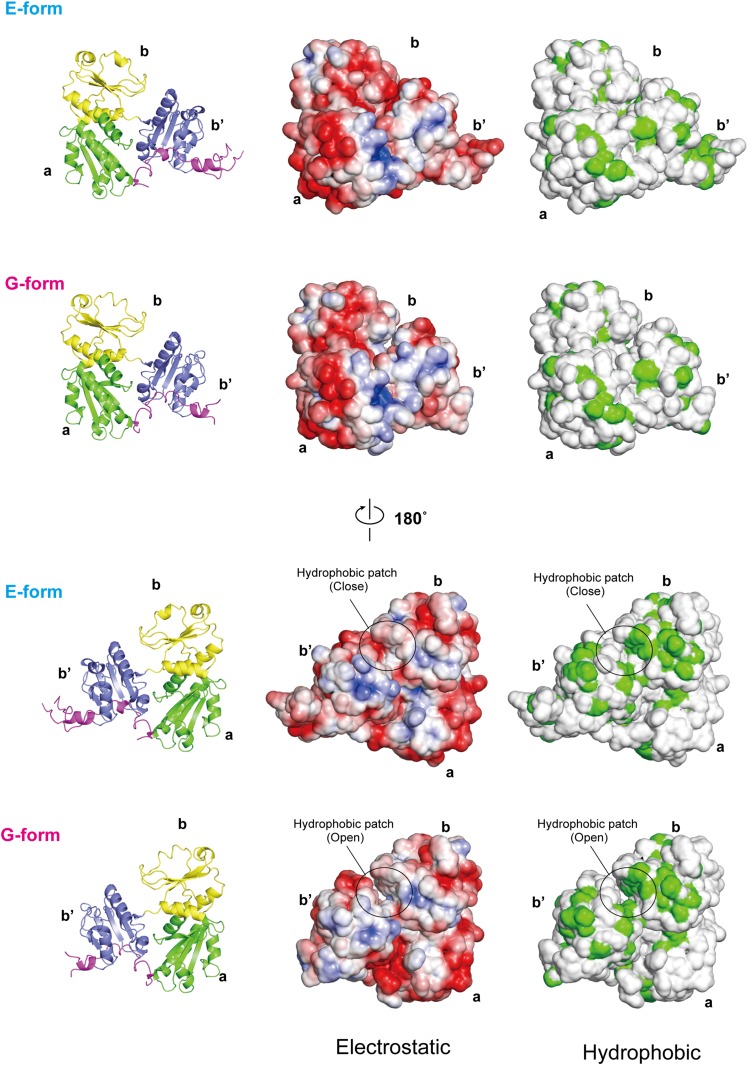
Fig. S2.
Comparison of the molecular surface properties of ERp44 at pH 7.2 and 6.5. (Left) Ribbon representations of the molecules as a reference. (Center) Electrostatic potential of ERp44, in which positively and negatively charged regions are shown in blue and red, respectively. A circle highlights a hydrophobic patch formed at the interface of the b and b′ domains. (Right) Hydrophobicity of the molecular surface of ERp44. Hydrophobic residues (except main-chain oxygen and nitrogen atoms) are shown in green.

