Fig. S6.
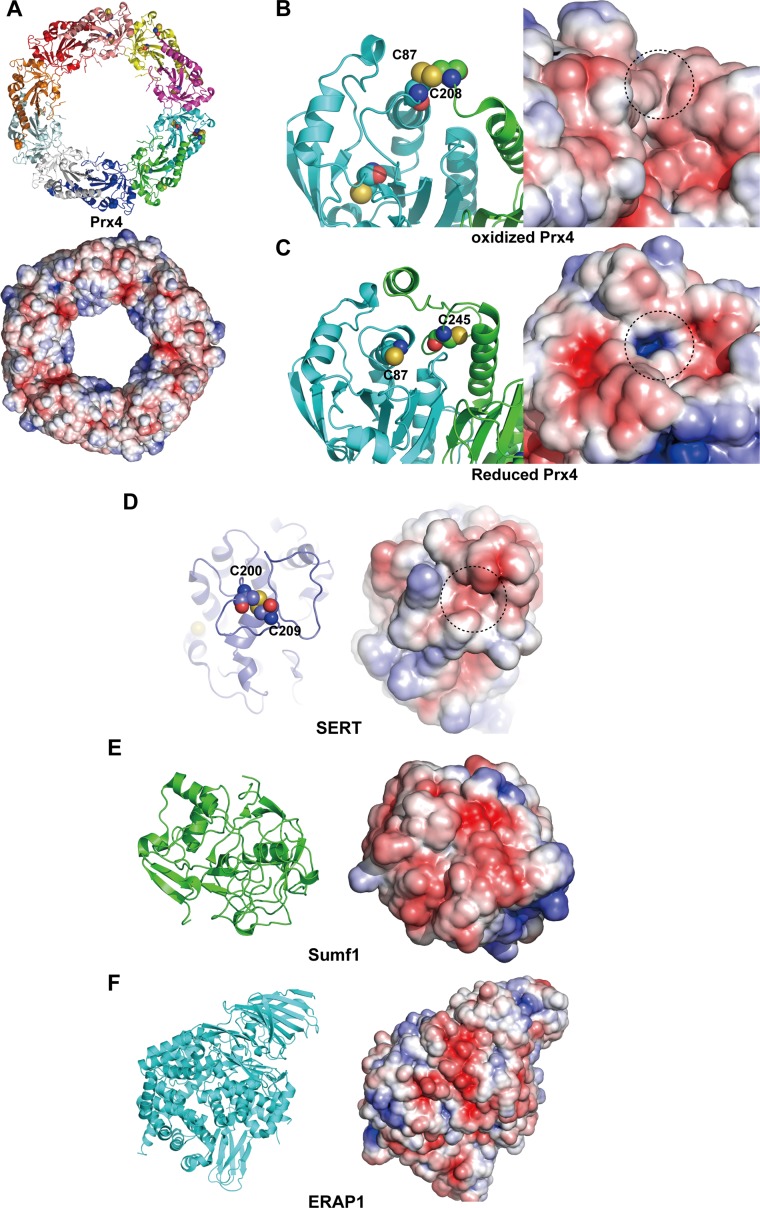
Surface properties of other ERp44 client proteins. (A) Overall structure of Prx4 in ribbon representation (Upper) and surface representation with electrostatic surface potential (Lower). (B and C) Close-up view of the active-site cysteine residues of the oxidized (B) and reduced (C) forms of Prx4. (Left) The indicated cysteine residues are represented by spheres. (Right) Electrostatic surface potential of oxidized Prx4, in which positively and negatively charged regions are shown in blue and red, respectively. The dotted circles highlight regions around the indicated cysteine residues. (D, Left) Close-up view of the Cys200–Cys209 disulfide bond of SERT, in which the indicated cysteine residues are represented by spheres. (D, Right) Electrostatic surface potential of SERT, in which positively and negatively charged regions are shown in blue and red, respectively. The dotted circle highlights a region around the indicated cysteine residues. (E and F) Overall structures of Sumf1 (E) and ERAP1 (F) in ribbon representation (Left) and surface representation with electrostatic surface potential (Right).

