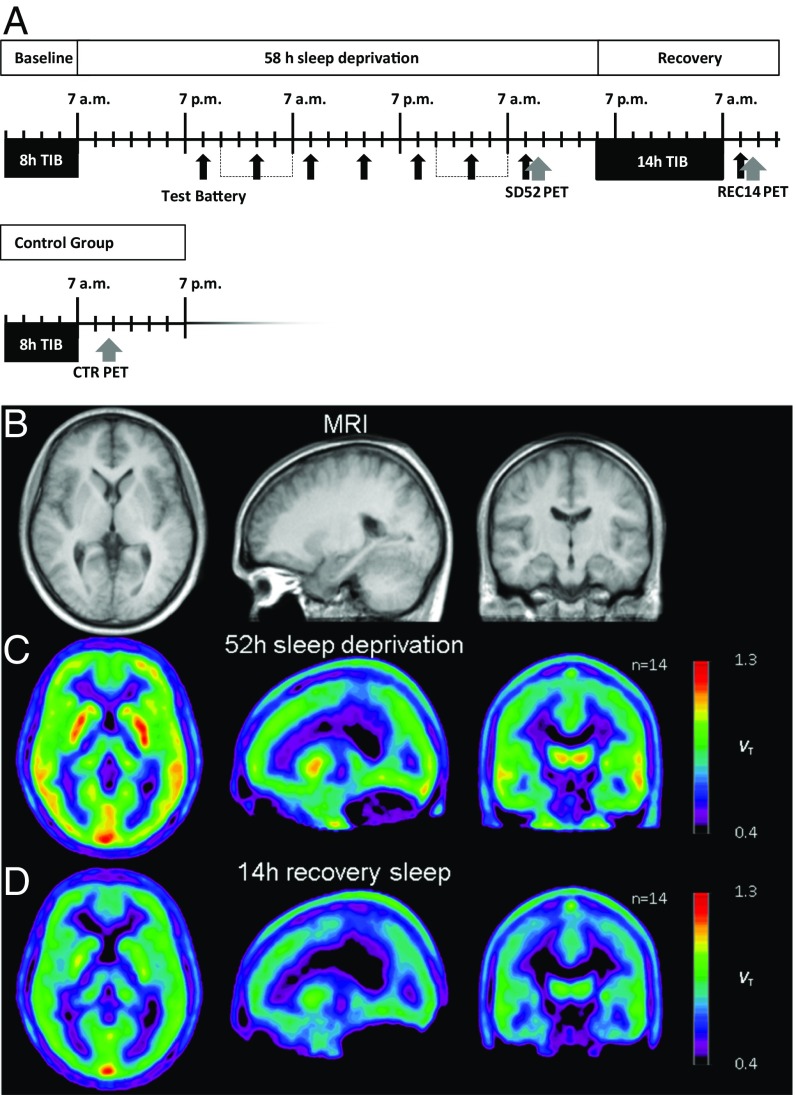
Fig. 1.
(A) Study design. Black arrows indicate times of the six hourly neuropsychological testings. Gray arrows indicate time points of PET scans. TIB, time in bed. Average images of anatomy (B, MRI) and A1AR availability (C and D, PET) after spatial normalization. (Left) Axial, (Middle) sagittal, (Right) coronal views; coordinates according to the Montreal Neurological Institute Brain Atlas were 22, −17, 0 (x, y, z); n = 14.

