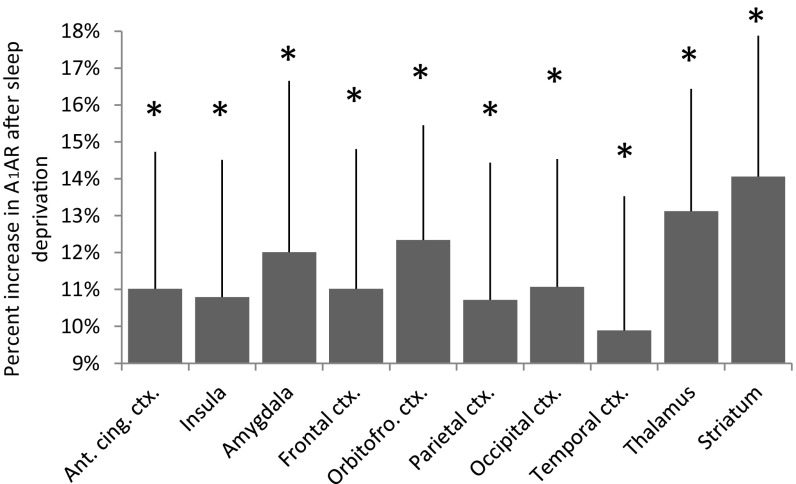
Fig. 2.
Average relative differences [(SD52 – REC14)/SD52] of A1AR availability (distribution volume VT) in brain regions. Error bars indicate SEMs. The asterisks represent significant differences between sleep deprivation and recovery (paired t test, *P < 0.022) (Table 1), n = 14. Ant. cing. ctx., anterior cingulate cortex; Orbitofro., orbitofrontal.

