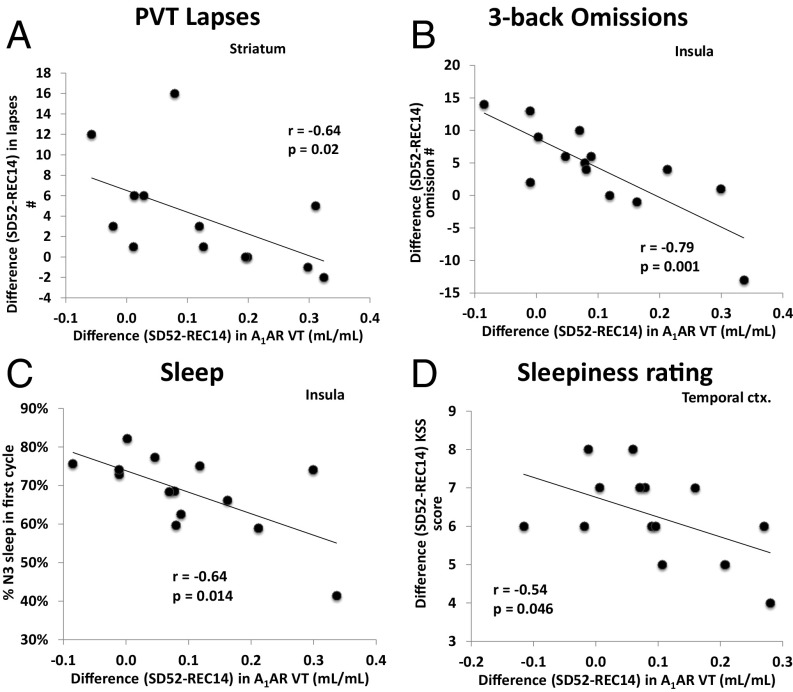
Fig. 3.
Significant correlations (Spearman) and regressions between the difference of A1AR distribution volumes (VT) after sleep deprivation and recovery sleep and (A) difference in PVT performance (number of lapses of attention) in the striatum, (B) difference in 3-back performance (number of omissions) in the insula, (C) fraction of slow-wave sleep in the first sleep cycle in the insula, (D) subjective sleepiness rating in the temporal cortex (ctx.).

