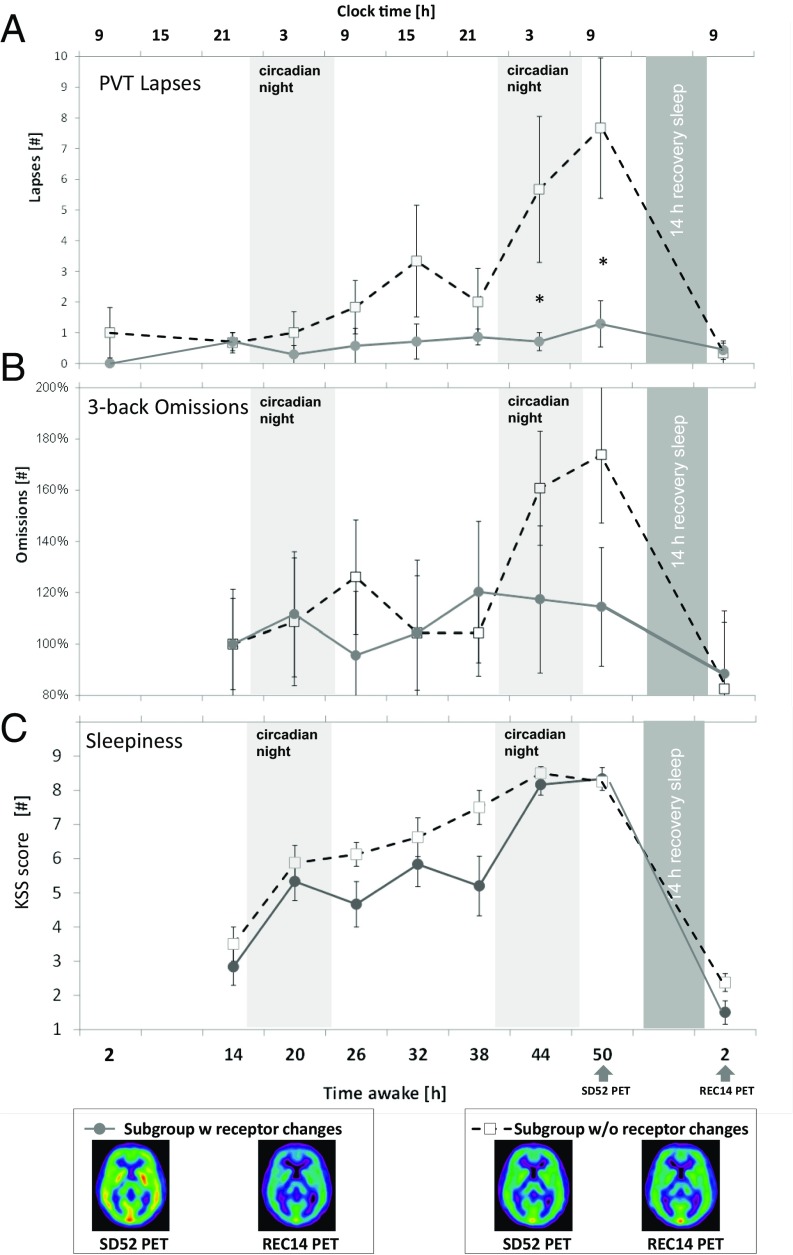
Fig. 4.
Time course of (A) PVT, (B) 3-back omissions, and (C) KSS-sleepiness during 58 h of sleep deprivation and after 14 h of recovery sleep. Based on high or low A1AR availability, the subjects were divided into two subgroups. The absolute difference of the test–retest evaluation revealed that in the striatal region the average of the absolute difference between scans was 0.1 (29). This variance was selected as cut-off criterion for selecting groups with high and low receptor availability. The small insets indicate average parametric receptor maps of subgroup high or low A1AR availability at corresponding time points. Error bars indicate SEM. An asterisk represents significant differences in unpaired t tests between subgroups at corresponding time points. For visualization purposes N-back time courses have been normalized to the respective baseline values at 14 h awake.

