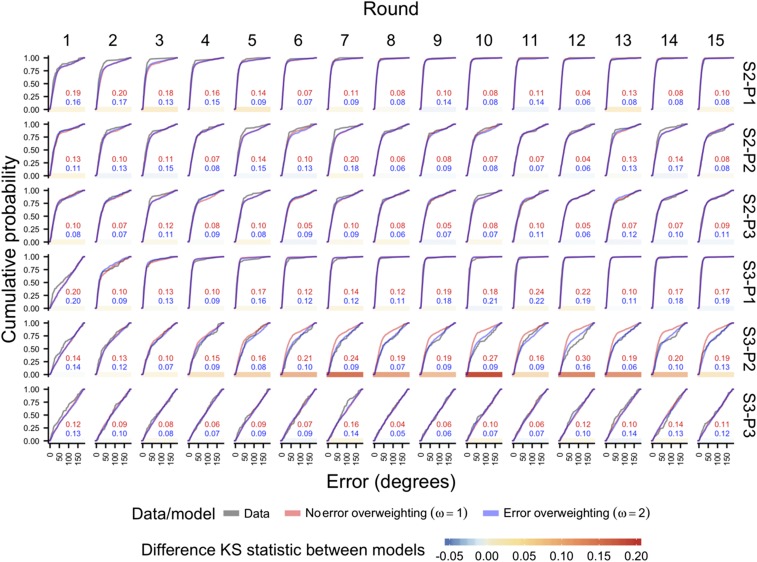
Fig. S3.
Comparison of the model performance with and without the overweighting of the partner’s errors (i.e., and ), for each of the 15 rounds and each of the six conditions. Subpanels show smoothed empirical cumulative distribution function plots for the observed errors of participants (data) and the two models. Numbers indicate the Kolmogorov–Smirnov (KS) statistic D when comparing an empirical distribution to the distributions predicted by either model. D measures the maximum distance between the cumulative distribution functions of the empirical and predicted distributions and thus indicates the misfit of either model. The color bars at the Bottom of each subpanel color-code the difference in D between the two models for that condition and round; positive numbers indicate that the model with (i.e., no error overweighting) deviated more from the observed data than the model with . The predictions are clearly superior when they include the overweighting of the partner’s errors, as the simpler model fails to reproduce the observed dynamics in condition S3-P2 (individuals, S, facing a high difficulty level of 3 paired with partners, P, facing a medium difficulty level of 2). The simpler model expects much lower errors than observed. The average values of the distributions are shown in Fig. S2.

