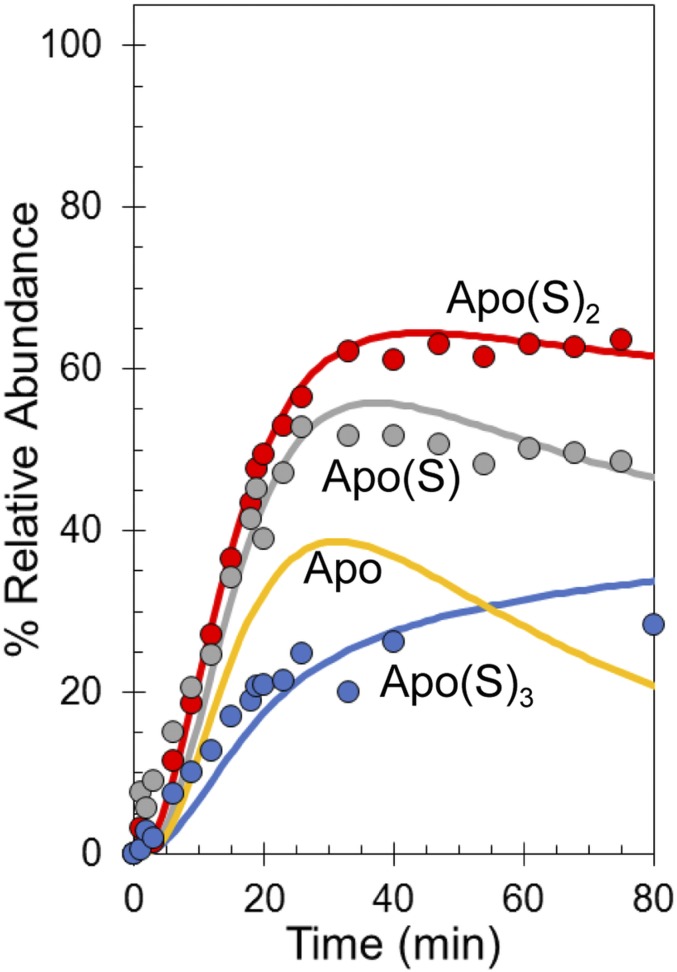
Fig. S3.
Tracking sulfide oxidation by LC-MS. Plots of relative abundances of apo-S (gray circles), apo-SS (red circles), and apo-SSS (blue circles) detected by LC-MS after exposure to excess O2. Global fits to the experimental data using the reaction scheme depicted in Fig. 5C are shown as solid lines. The predicted response of the apo species is shown in yellow (note the similarity to the apo species’ behavior in Fig. 4B). The global fitting model was initiated with 100% relative abundance of [4Fe-4S] clusters.

