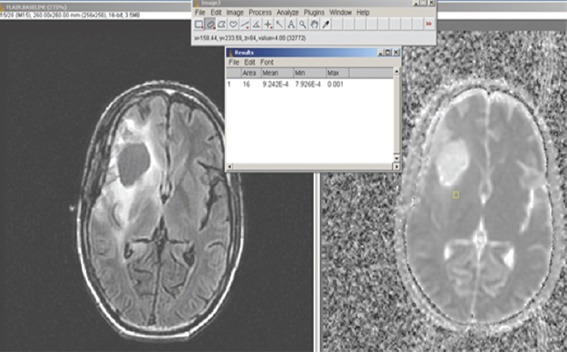
Figure 1.

Placement of region of interest seen as a small rectangle in the apparent diffusion coefficient map (right panel) in an area that corresponds to the bright signal in the tumor seen on the fluid-attenuated inversion recovery image in a low-grade glioma (left panel). The value is read off from the ImageJ software, top
