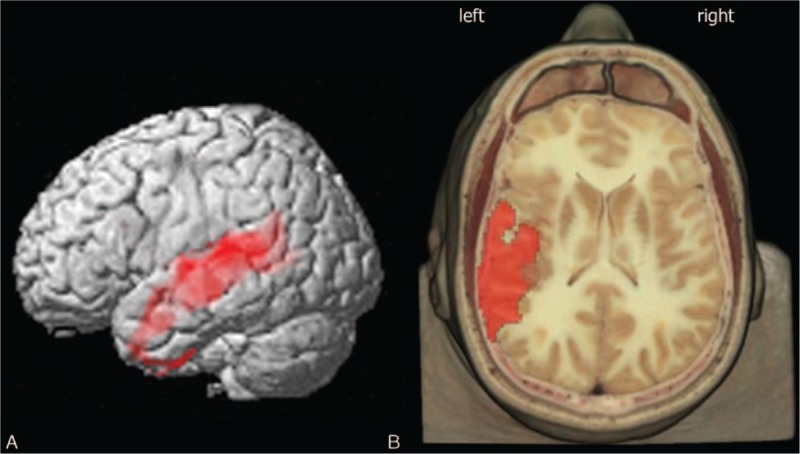
Figure 1.

3D rendering of data presented in Table 2 in (A) showing the negative correlation between Qalb and brain glucose consumption in left temporal lobe (left superior temporal gyrus). (B) Axial anatomical brain image superimposition of the brain regions presented in Table 2 (threshold P < 0.01 corrected for multiple comparisons with false discovery rate at the voxel level). Coordinate and regional details are presented in Table 2.
