
Figure 4.
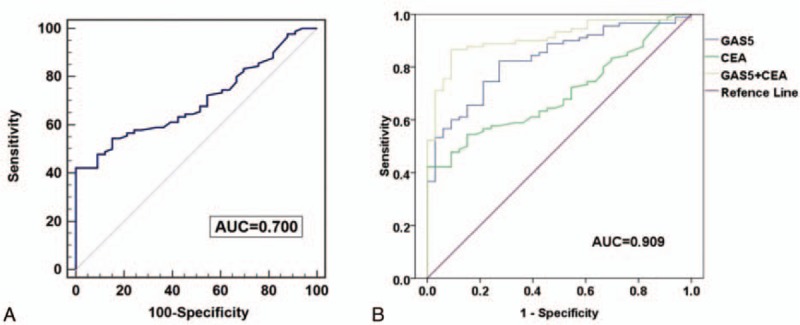
The ROC curve analysis of GAS5 in NSCLC cases and healthy controls. A, The results of the ROC curve analysis of the CEA assay. B, The analysis of the predictive effect of CEA and GAS5. CEA = carcinoembryonic antigen, GAS5 = growth arrest-specific transcript 5, NSCLC = nonsmall cell lung cancer, ROC = receiver-operating characteristic curve.