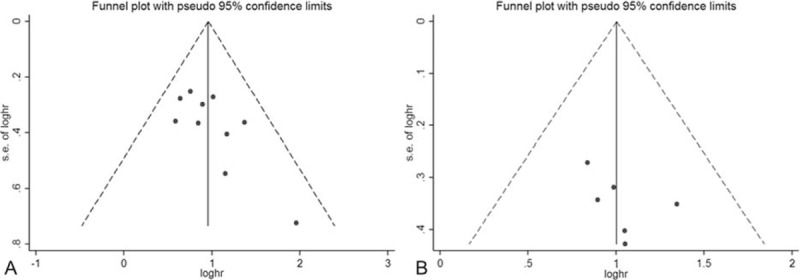
Figure 6.

(A) Funnel plot of publication bias on the relationship between miR-218 expression and OS. The vertical line in the funnel plot indicates the fixed-effects summary estimate, whereas the sloping lines indicate the expected 95% CI for a given SE. (B) Funnel plot of publication bias on the relationship between miR-218 expression and DFS/PFS/RFS.
