
Figure 3.
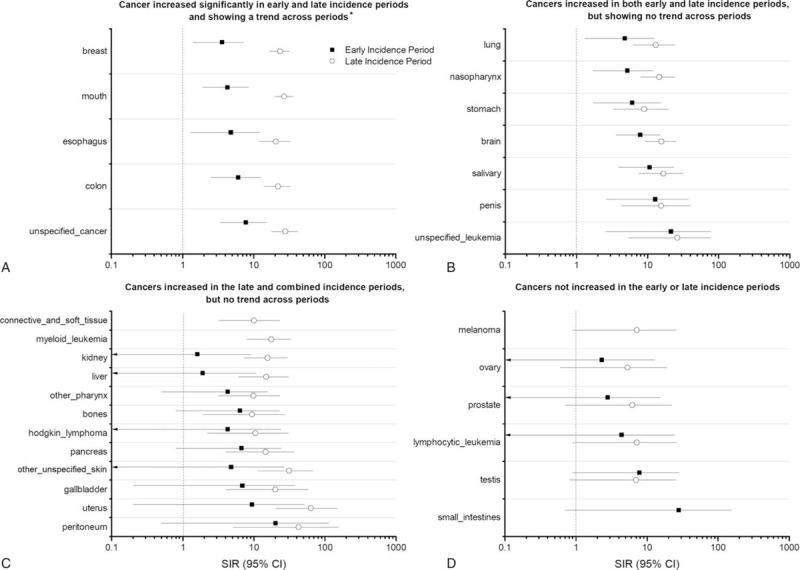
The figure includes four panels each showing graphical representation of standardized incidence ratio (SIR) in the early (EI) and late incidence (LI) periods with 95% Poisson confidence intervals for different non-AIDS-defining cancers among persons living with HIV (PLHIV) in Pune. SIRs are plotted on a logarithmic scale. (A) Depicts SIR for cancers that are significantly associated with HIV in both early and late incidence periods and additionally shows a significantly increasing trend from early to late periods. ∗P (trend) values are: breast (P < 0.001), mouth (P < 0.001), esophagus (P = 0.007), colon (P = 0.002), unspecified cancers (P = 0.001). (B) Depicts SIRs for cancers that are also significantly associated with HIV in both early and late incidence periods; however, they do not show increasing trend from early to late periods. Note: SIR for eye and orbit (shown in table 2) is not shown in this figure. (C) Depicts SIRs in early and late incidence periods for cancers that are significantly raised in late and combined incidence periods and therefore considered to be possibly associated with HIV (data for combined period is shown in Table 2). However, they do not show increasing trend from early to late periods. (D) Depicts the SIRs for cancers which are not significantly elevated in either the early or late periods and are hence considered “not associated” with HIV.