
Fig. 1.
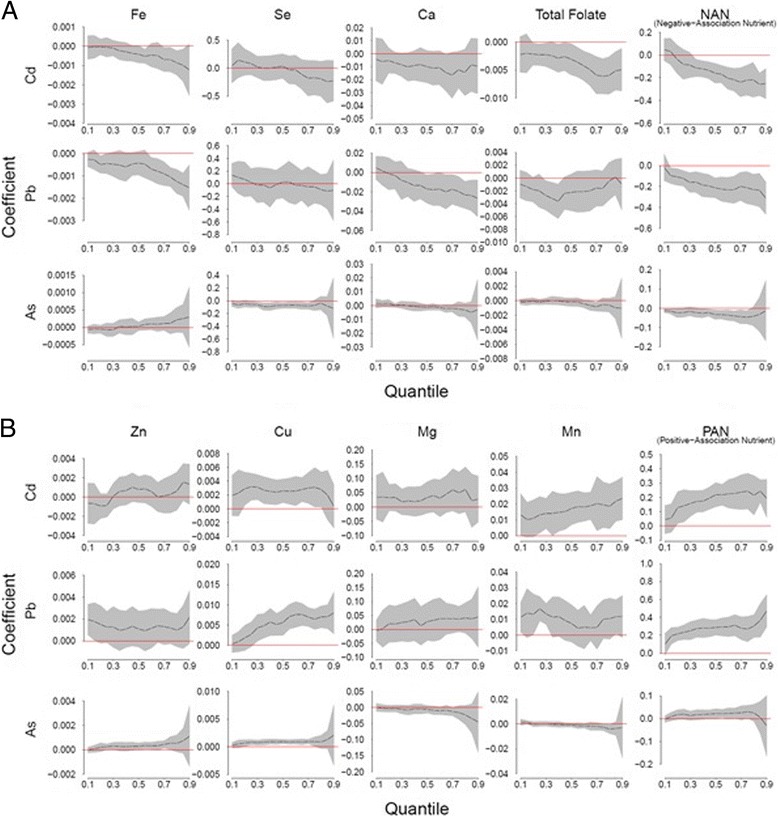
Quantile regression coefficients of 8 nutrients and their indices and toxic metals, Cd, Pb and As. The Y axis indicates the regression coefficients of a nutrient for a given toxic metal; the X axis indicates the quantile of toxic metals. Grey area indicates the 95% simultaneous confidence band for the quantile coefficient estimation; red line indicates regression coefficient = 0