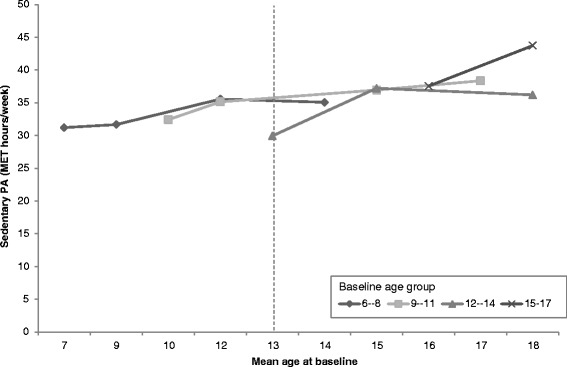
Fig. 4.

Age trends in mean Sedentary behaviour among girls in the CHNS by baseline age groups (MET-hrs/wk). Notes: Points represent Sedentary behaviour level of female children at the mean age for the age group in each survey year (2004, 2006, 2009, 2011). The vertical dotted line illustrates the difference in estimated PA level for a 13-year old girl in 2004 vs 13-year old girl in 2006 vs a 13-year old girl in 2009 (cohort effect)
