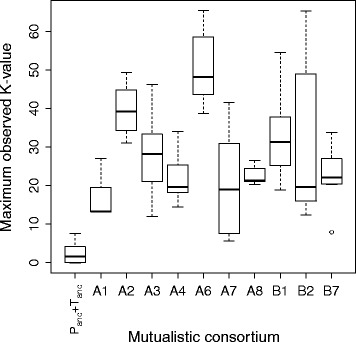
Fig. 4.

Magnitude of cell aggregation within the ancestral and evolved mutualistic consortia. Cell aggregation was measured as the maximum observed K-value. Definitions: Panc, ancestral strain of BW25113 (∆proC); Tanc, ancestral strain of BW25113 (∆trpC). The data are presented as Tukey box plots. All the mutualistic consortia had larger K-values than the ancestral consortia, indicating an increase in cell aggregation over the course of the evolution experiment
