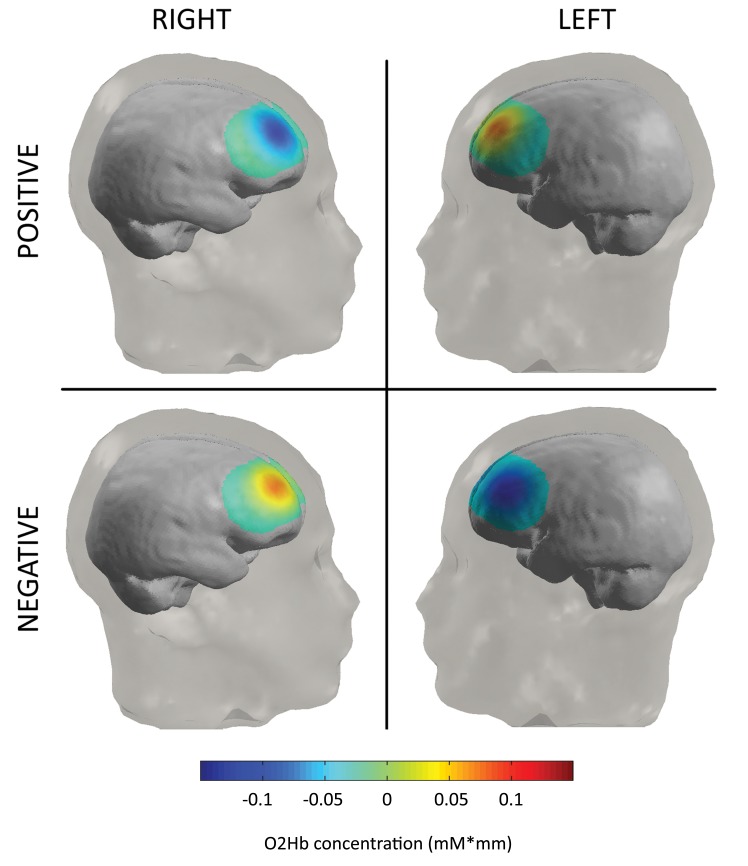
Figure 5.
Hemodynamic states (O2Hb relative concentrations) as a function of size and valence (obtained with Nirslab Software, Data viewer section, Map tool). In response to negative stimuli, the concentration of O2Hb was higher for the right than the left side. Moreover, the concentration of O2Hb was higher in response to negative more than positive stimuli within the right side.

