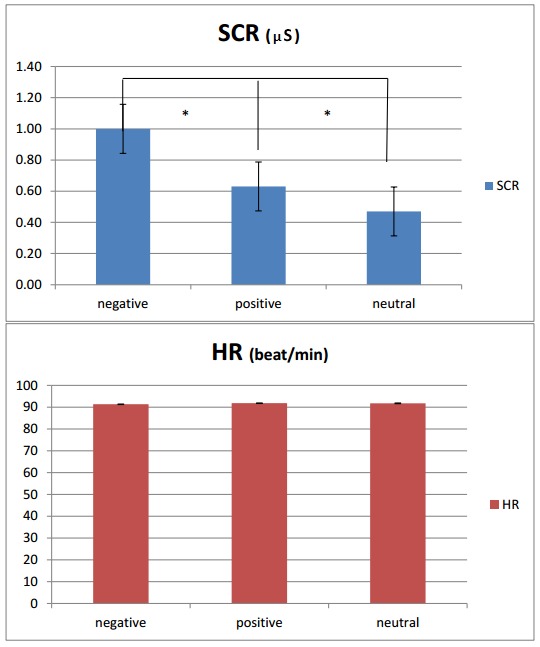
Figure 6.

Mean values for SCR (up) and HR (down), with a significant effect shown for SCR based on positive versus negative valence. (M and SD reported. Asterisks mark statistical significance, with p ≤ .05.)

Mean values for SCR (up) and HR (down), with a significant effect shown for SCR based on positive versus negative valence. (M and SD reported. Asterisks mark statistical significance, with p ≤ .05.)