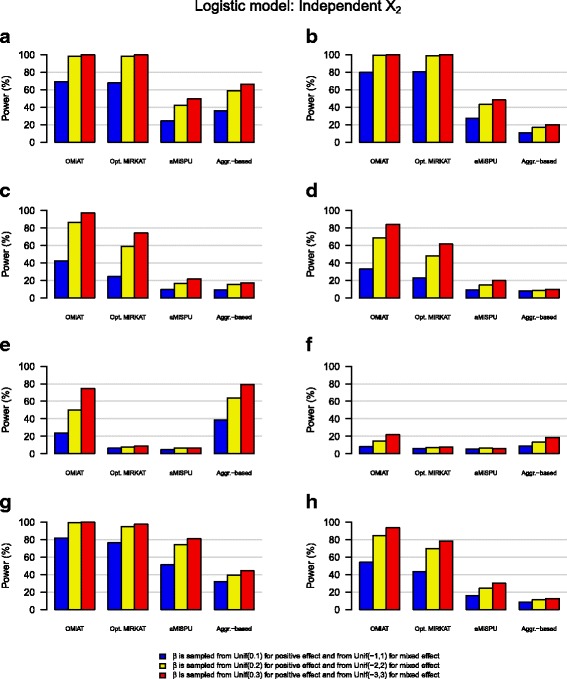
Fig. 1.

Power estimates for the logistic model when the covariate X2 is independent with OTUs. a Positive effect: OTUs in upper 10% in abundance. b Mixed effect: OTUs in upper 10% in abundance. c Positive effect: a random 10% of OTUs. d Mixed effect: a random 10% of OTUs. e Positive effect: OTUs in lower 10% of abundance. f Mixed effect: OTUs in lower 10% of abundance. g Positive effect: OTUs in the cluster. h Mixed effect: OTUs in the cluster
