
Figure 2.
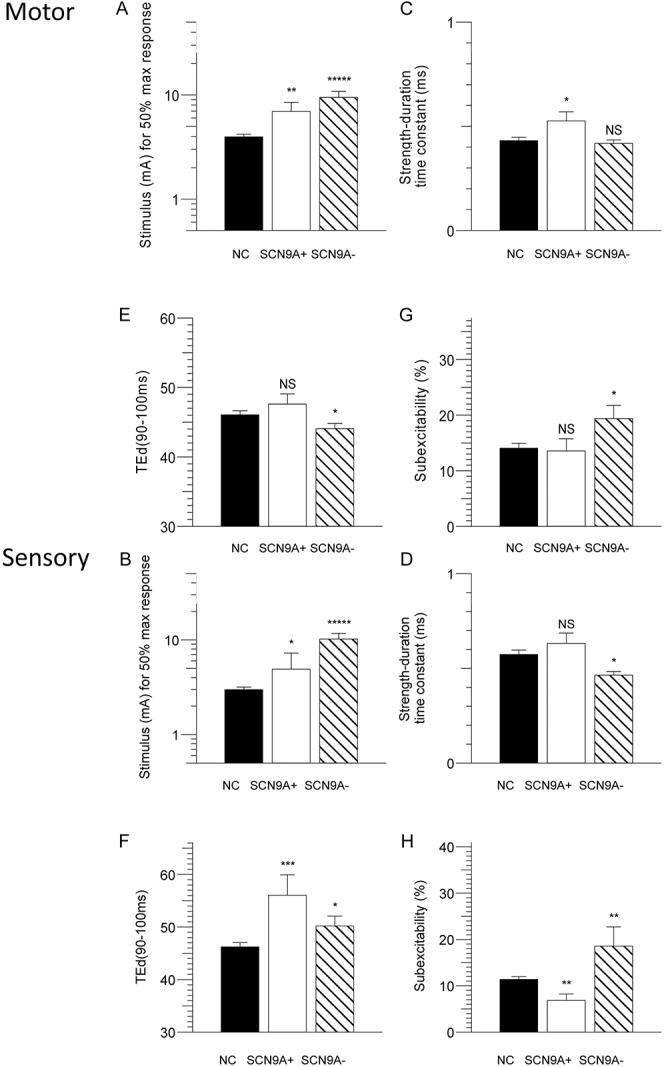
Comparison of multiple measurements of axonal excitability in motor (top panel) and sensory axons (bottom panel) in patients with erythromelalgia (EMSCN9A+, open; EMSCN9A−, hatched) and normal controls (filled) plotted as mean and SEM of motor and sensory fibres. (A, B) Stimulus for 50% maximum response. (C, D) Strength–duration time constant. (E, F) TEd (90-100 ms). (G, H) Subexcitability.