
Figure 5.
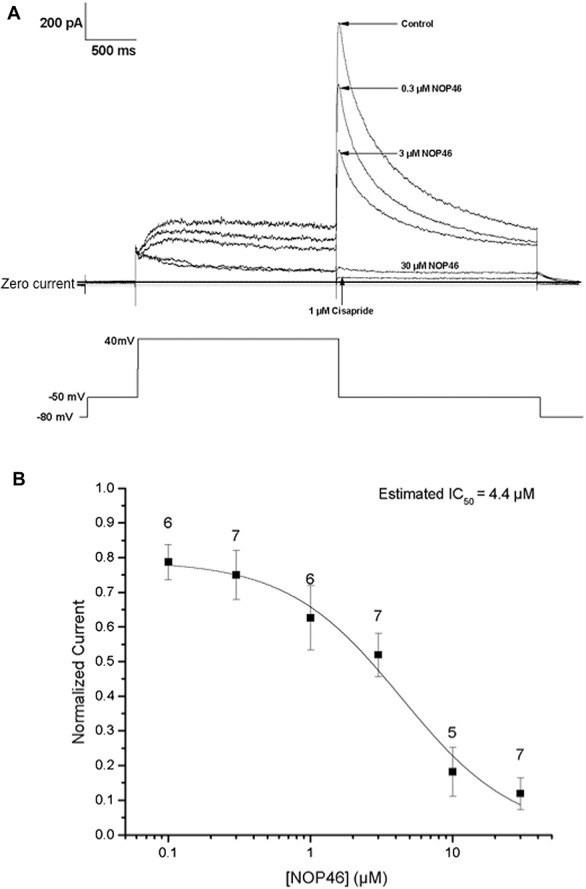
The effect of N46 on the amplitude of hERG tail currents. (A) The voltage protocol (lower panel) was applied to the cell once every 10 seconds. Recordings were obtained in the presence of control solution and after the addition of 0.1, 0.3, 1.0, 3, 10 and 30 μM N46 and the positive control, 1 μM cisapride-evoked hERG tail currents were continuously monitored throughout the experiment. Each concentration of N46 was added to each cell for 5 minutes and the next dose was cumulatively applied and sample responses to 3 of the concentrations and the control are shown. (B) A 6-point dose response was collated from 13 individual cells. Each point represents the mean percent inhibition at each concentration. Error bars indicate the mean ± SEM.