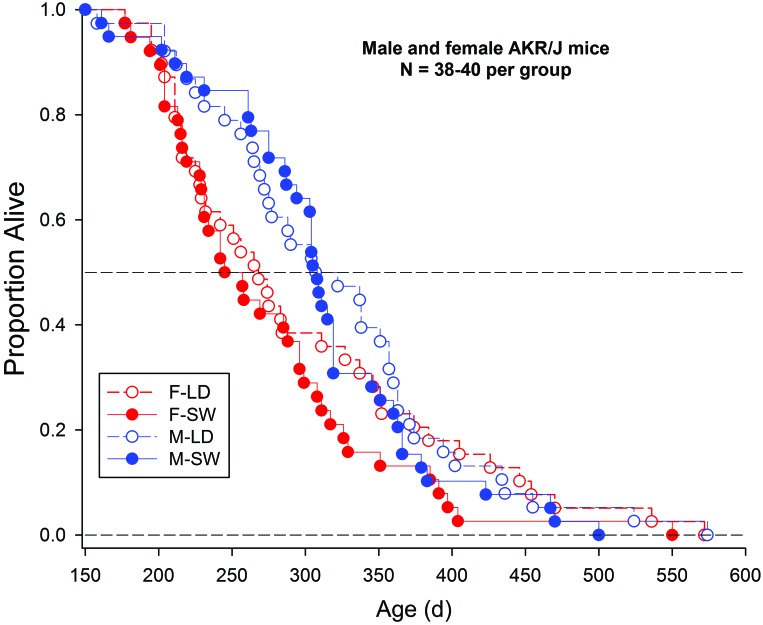
Figure 3.
Kaplan–Meier plot of survival curves of AKR/J mice exposed to stable or shifted LD cycles. Male (M) and female (F) AKR/J mice were exposed to either a stable 12:12-h LD cycle or to a repeated DPS cycle simulating SW (n = 38 to 40 per group) beginning at 5 wk of age and continuing until death.

