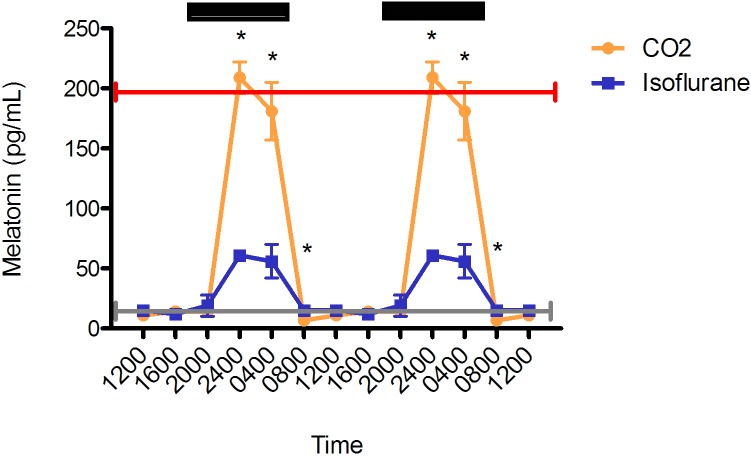
Figure 1.
Circadian rhythm of arterial plasma melatonin (pg/mL) concentrations in rats that underwent isoflurane anesthesia (blue) compared with brief CO2 anesthesia (amber). Black bars represent the dark phase; *, significant (P < 0.05) difference between groups. Values are double plotted. The total numbers of samples after pooling (see methods) at time points 0400, 0800, 1200, 1600, 2000, and 2400 were 5, 3, 6, 2, 4, and 6 for the isoflurane group and 7, 6, 6, 6, 4, and 10 for the CO2 group, respectively. For reference, the peak nighttime (red line) and daytime (gray line) values in decapitated Wistar rats are shown.9

