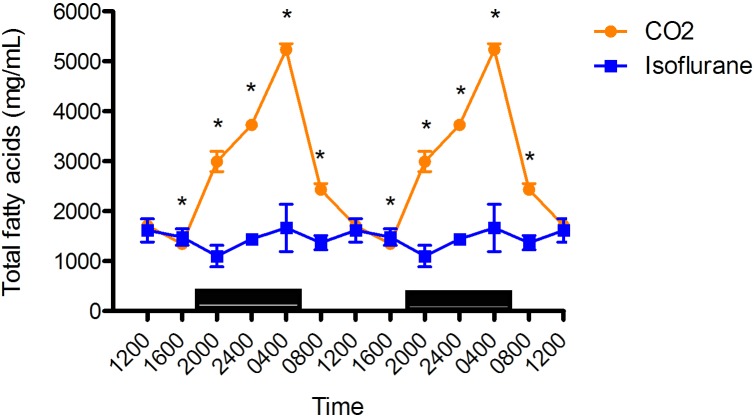
Figure 3.
Circadian rhythm of arterial plasma total fatty acids (µg/mL) concentrations in rats that underwent isoflurane anesthesia (blue) compared with brief CO2 anesthesia (amber). Black bars represent the dark phase; *, significant (P < 0.05) difference between groups. Black bars represent the dark phase; *, significant (P < 0.05) difference between groups. Values are double plotted. The total numbers of samples at time points 0400, 0800, 1200, 1600, 2000, and 2400 were 6 in all cases for the isoflurane group and 11, 12, 12, 12, 12, and 12 for the CO2 group, respectively. The current report is the first description of circadian rhythmicity in plasma TFA concentrations of Sprague–Dawley rats; however, the circadian rhythmicity of plasma fatty acids is well known.1

