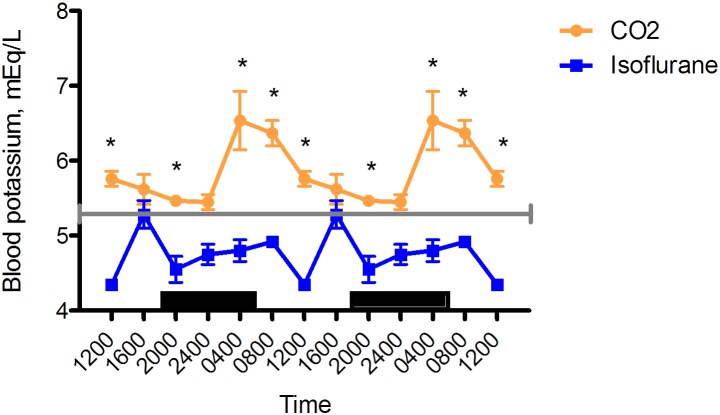
Figure 7.
Circadian rhythm of arterial blood potassium (mEq/L) concentrations in rats that underwent isoflurane anesthesia (blue) compared with brief CO2 anesthesia (amber). Black bars represent the dark phase; *, significant (P < 0.05) difference between groups. Values are double plotted to show rhythmicity. The total numbers of samples at time points 0400, 0800, 1200, 1600, 2000, and 2400 were 6 in all cases for the isoflurane group and 11, 12, 12, 12, 11, 12 for the CO2 group, respectively. For reference, the gray line represents the vendor-reported mean value for Sprague–Dawley rats.30

