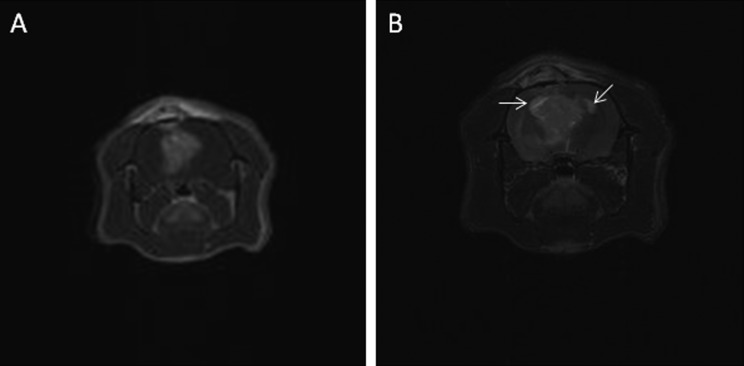
Figure 6.
Group 3 (Fischer rats, F98 glioma cells): T1-weighted (A) and T2-weighted (B) transverse images of rat n. 29 at day 11: in the T-2 weighted images the signal of the lateral ventricles filled with cerebrospinal fluid (arrows) can be confused with the tumor signal. Owing to the tendency of the Fischer model to involve and follow the pattern of the ventricular system, T1-weighted postcontrast images were preferred for measuring tumor volume.

