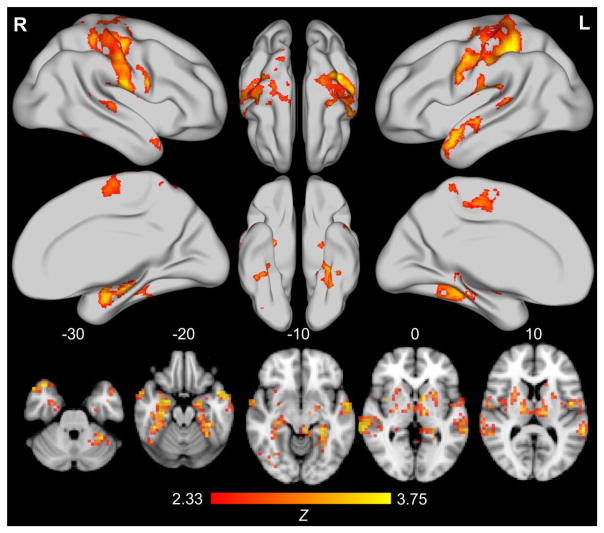
Figure 4. Results from multivariate distance matrix analysis of the functional connectome between C1 and C2.
Adjacent groups at the highest level of hierarchical clustering (level 1: nC1=165, nC2=115) are displayed. Rendered brains and axial slices reflect multivariate distance matrix regression comparing intrinsic connectivity between groups; findings represent conversion of pseudo-F test results to Z values via permutation testing (10,000 resamplings of data) and permutation-based cluster correction (5,000 resamplings of data) with cluster formation set at p < .01 and extent threshold set at p < .05. Note that images are presented in neurological convention (L=R, R=L). The bottom row of axial slices represents significant findings at MNI axis Z values of −30, −20, −10, 0, and 10. From left to right, top to bottom, the top 2/3 of the figure depicts the lateral and medial surface of the right hemisphere, the dorsal and ventral surface of the right, then left, hemisphere, and finally, the dorsal and medial surface of the left hemisphere. Only Level 1 results survived cluster permutation testing correction for multiple comparisons.

