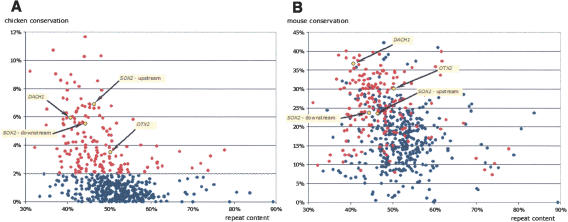
Figure 3.
Correlation of nonrepetitive conservation of the human gene deserts with chicken (A) and mouse (B) versus repeat content. Red color depicts the stable gene deserts that are >2% conserved with chicken throughout their length. Negative correlation of the nonrepetitive conservation level and repeat content is very weak in both chicken and mouse comparisons, with R2 reaching 0.06 in the case of mouse comparisons. Two stable gene deserts located upstream of the DACH1 and OTX2 gene and two other ones surrounding the SOX2 gene are in yellow.

