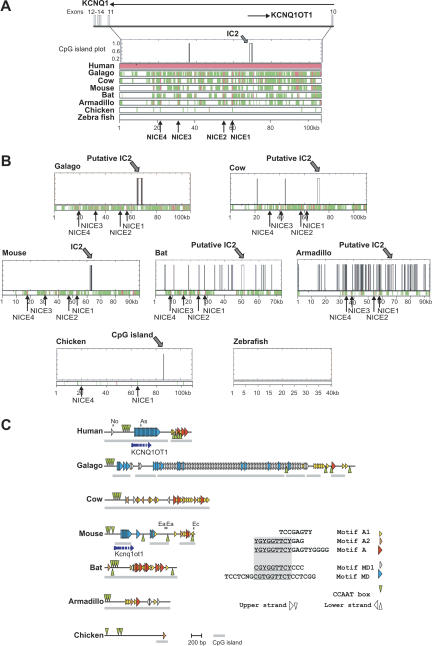
Figure 3.
Sequence conservation in Kcnq1 intron 10 in vertebrates. (A) Multiple alignments of Kcnq1 intron 10: the genomic human sequence was taken as reference sequence and compared to the genomic galago, cow, mouse, bat, armadillo, chicken, and zebrafish sequences. Before alignment, repetitive elements were masked using RepeatMasker software. Aligned regions are shown in green, highly conserved elements in red (>70% identity, >100 bp length). NICE1–NICE4 are highly conserved in all analyzed mammals. NICE1 and NICE4 are conserved in chicken (>60% identity, >100 bp length). The position of the IC2 CpG island in the human sequence is indicated by the CpG island plot above the multiple alignment. The CpG island plot shows CpG islands that fulfil the definition of a CpG island (length >200 bp, G+C content >50%, CpGobserved/CpGexpected >0.6, http://www.ebi.ac.uk/emboss/cpgplot/). The given scale bar is related to the human sequence. (B) The distributions of CpG islands in Kcnq1 in different vertebrate species. In pairwise alignments, the vertebrate sequences were used as reference sequences and the human sequence as second sequence. Scale bars are related to the reference sequence in each alignment. (C) Arrangements of repeated conserved sequence motifs in the putative IC2 in mammals. The consensus sequences of conserved motifs are listed. Segments that are conserved in overlapping motifs are underlined. The arrangements of these motifs in the different species are shown by different triangles. Motif MD was identified by Mancini-DiNardo et al. (2003). For the identified motifs the following numbers of mismatches to the consensus sequence were allowed: motif A, three mismatches; motifs MD1 and A2, two mismatches; motif A1, one mismatch; motif MD, six mismatches; CCAAT boxes, no mismatches. In some species the analyses were extended to regions flanking the CpG islands that are highlighted by gray bars. For the mouse and human sequences, the transcriptional start sites of Kcnq1ot1 (Du et al. 2004) are depicted by broken arrows indicating that the 3′extension of the transcript is not known. In mouse and human, location of restriction sites (No, NotI; As, AscI; Ea, EagI; Ec, EcoRI) that have been used for characterization of the IC2 in other studies (Du et al. 2003, 2004; Mancini-diNardo et al. 2003) are indicated.

