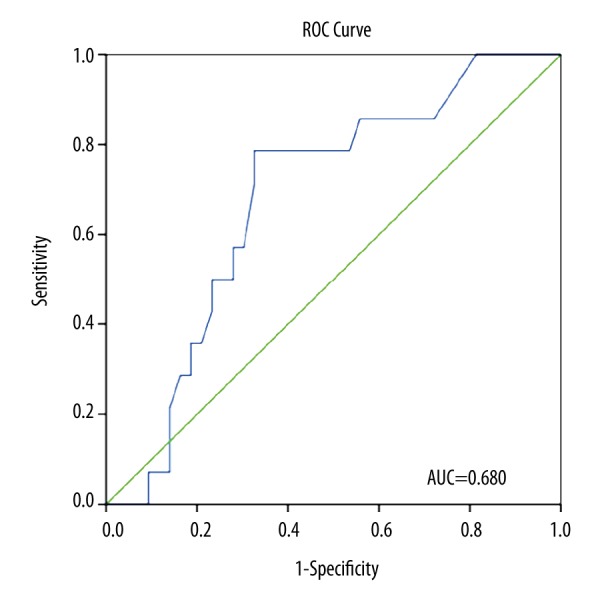
Figure 1.

Relative operating characteristics (ROC) curve of plasma fibrinogen levels for prediction of G ≥11 dynes/cm2 (area under the curve [AUC]=0.680, 95% confidence interval [CI] 0.53–0.80, p=0.044). The optimal cutoff point for fibrinogen to predict G ≥11 was 3.97 g/l (sensitivity of 78.6%, specificity of 67.4%).
