
Figure 1.
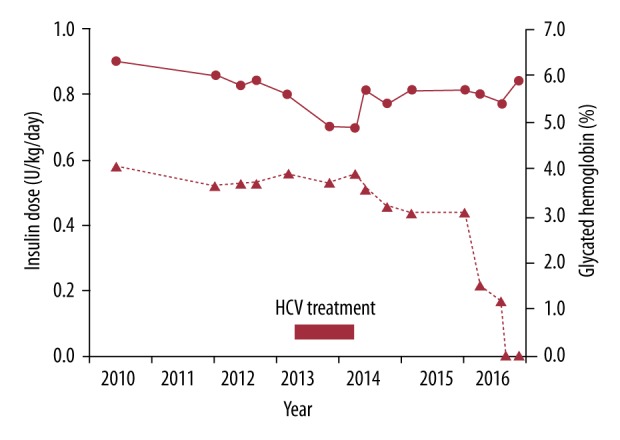
Insulin dose in U/kg/day (▴- - -▴) on the left axis and HbA1c (●—●) on the right axis before, during and after successful HCV treatment in a 55-year-old man.
Official websites use .gov
A
.gov website belongs to an official
government organization in the United States.
Secure .gov websites use HTTPS
A lock (
) or https:// means you've safely
connected to the .gov website. Share sensitive
information only on official, secure websites.
Insulin dose in U/kg/day (▴- - -▴) on the left axis and HbA1c (●—●) on the right axis before, during and after successful HCV treatment in a 55-year-old man.