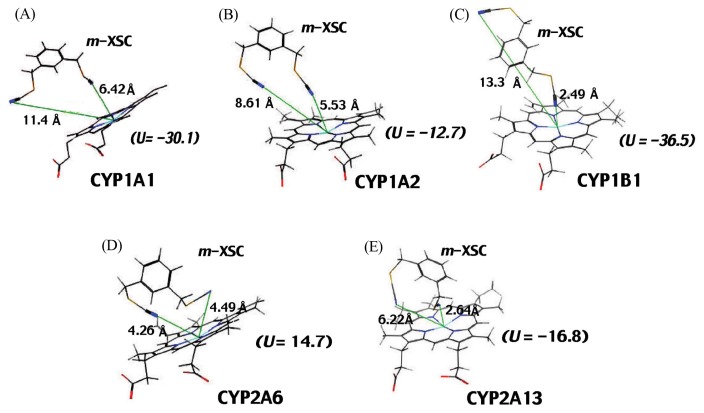
Fig. 9.
Molecular docking analysis of interaction of m-XSC with CYP1A1 (A), 1A2 (B), 1B1 (C), 2A6 (D), and 2A13 (E). The ligand-P450 interaction energies (U values) and distances between the N-atom in one of the -CH2SeCN moieties of m-XSC and the Fe-atom (calculated using in silico analysis) in these P450s are shown in the figure.

