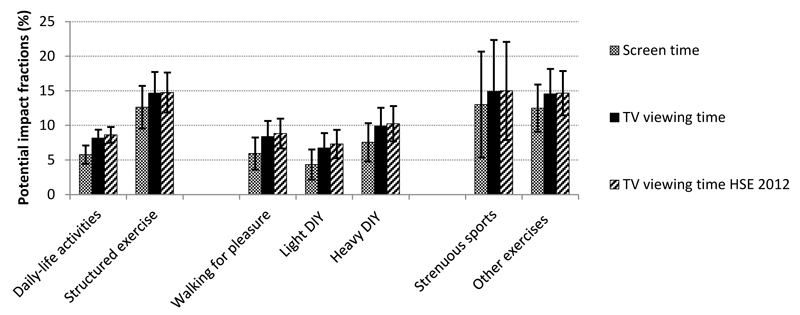
Figure 2.
Potential impact fractions (%; 95% confidence intervals) representing the proportionate decrease in incidence of all-cause mortality in the population if average screen time were to decrease by 30 minutes/day, while average time spent on the respective discretionary physical activity type increased by the same amount, assuming causality. Grey and black bars are based on distribution estimates from UK Biobank for screen time and TV viewing time respectively, whereas striped bars are based on the weighted TV viewing time distribution from the Health Survey for England 2012.

