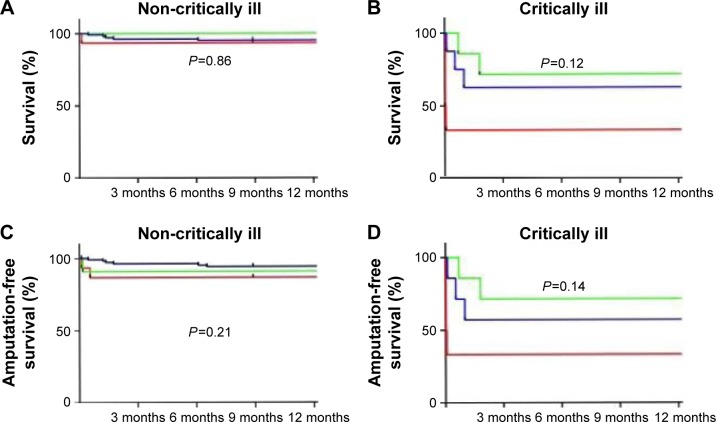
Figure 1.
Kaplan–Meier curves representing overall survival (A and B) and amputation-free survival (C and D) of Rotarex® (blue)-, lysis (green)-, and Rotarex®+lysis (red)-treated patients. The figure is subdivided into a population of noncritically ill (left panel) vs critically ill (right panel) patients. P-values are attributed to the corresponding subfigures.

