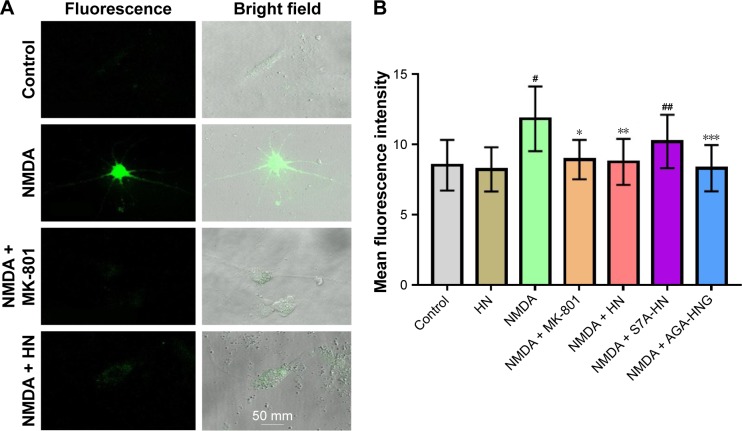
Figure 6.
Effect of HN on NMDA-induced ROS production.
Notes: (A) ROS production was visualized under confocal microscope (×400). (B) Changes in cellular ROS production in cortical neurons treated with NMDA with or without HN. A total of 1×10⁶ cells were quantified. Data are the mean ± SD of 5 independent observations by flow cytometry. Data were analyzed by 1-way ANOVA followed by post hoc Tukey’s test for multiple comparisons. #Control group versus NMDA group, P=0.000, *NMDA group versus NMDA + MK-801 group, P=0.000; **NMDA group versus NMDA + HN group, P=0.001, ##control versus NMDA + S7A-HN, P=0.019; ***NMDA versus NMDA + AGA-HNG, P=0.022. NMDA: 100 μmol/L; MK-801: 10 μmol/L; HN, S7A-HN, and AGA-HNG: 1 μmol/L each. NMDA is an excitotoxin that induces the overactivation of the NMDA receptor, causing excitotoxicity. MK-801 is a known uncompetitive antagonist of NMDA receptor, which could block the binding of NMDA.
Abbreviations: AGA-HNG, 100× more active form of HN; ANOVA, analysis of variance; HN, humanin; NMDA, N-methyl-D-aspartate; ROS, reactive oxygen species; S7A-HN, inactive form of HN; SD, standard deviation.

