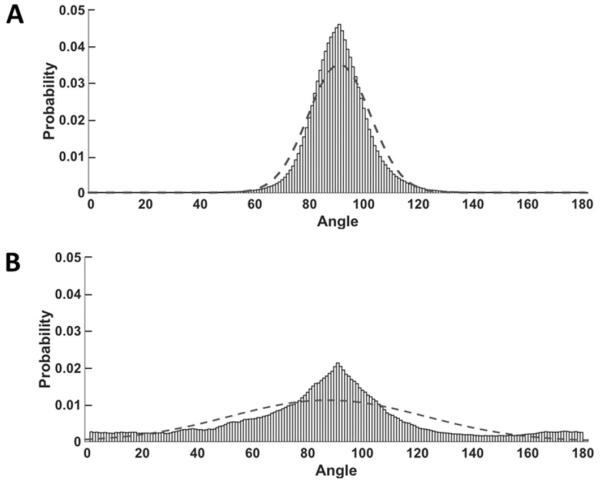
Fig. 6.
Fiber orientation differences between BM- and AD-ECMs. Data were fit to a normal distribution, with 90° corresponding to the mode of the observed orientations. The fit-line of the distribution is overlaid on the raw data. (A) Fibrous structures in BM-ECM displayed densely-organized and highly-oriented fibers (σ = 11.3), while AD-ECM fibers in (B) exhibited a broader range of orientations (σ = 35.6). Mean fiber orientation measurements were performed on 15 randomly-selected areas of BM- and AD-ECM (70 μM × 70 μM) atomic force microscopy images.

