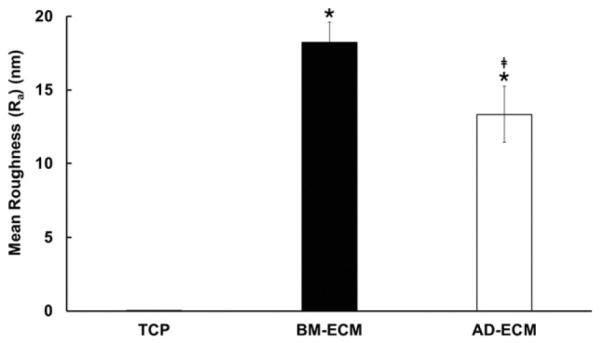
Fig. 7.

Surface topography of BM- and AD-ECMs. Measurement of surface roughness (Ra) was performed using atomic force microscopy on 15 randomly-selected areas measuring 70 μM × 70 μM. The roughness of TCP was too low to be measured using this method. * P < 0.05, vs. TCP; ‡P < 0.05, vs. BM-ECM.
