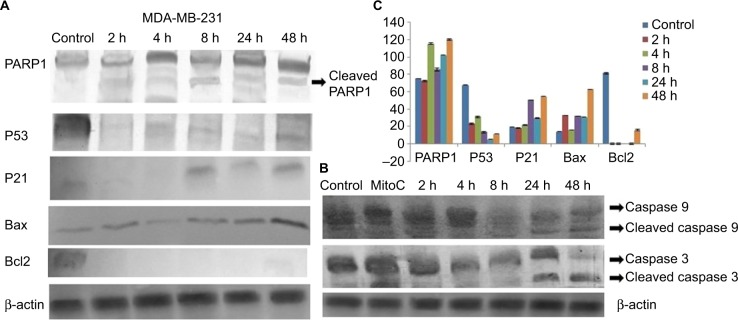
Figure 16.
Protein expression patterns in MDA-MB-231 cells at different time points after treatment with GSNPs (1.56 μg/mL).
Notes: (A) Shows expression patterns of PARP1, P53, P21, Bax and Bcl2 and (B) shows cleaved caspase 9 and cleaved caspase 3 protein expression. β-actin was taken as a loading control. (C) shows quantitative densitometric analysis of the protein expression pattern. The values are the mean ± SEM of two independent experiments.
Abbreviations: GSNP, green silver nanoparticle; SEM, standard error of the mean; MitoC, mitomycin C.

