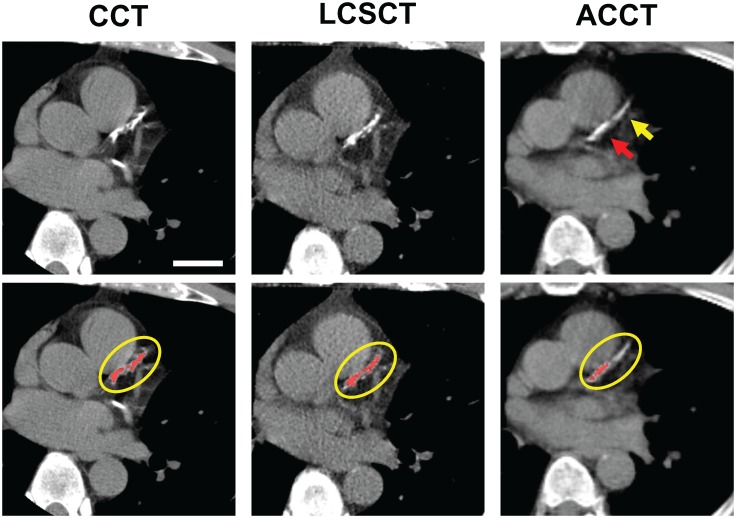
Fig 2. Example of the decreased detection of calcium using ACCT relative to CCT and LCSCT in a single slice plane of the LAD from an individual patient.
CCT with LAD Agatston CACS of 645. LCSCT with LAD Agatston CACS of 749. ACCT with LAD Agatston CACS of 203. Bar, 3cm. Upper panel; CT images at the level of the proximal to mid LAD. Red arrow; identified calcium. Yellow arrow; unidentified calcium. Lower panels; CT images as displayed at the imaging workstation with pixels of Agatston threshold of 130 Hounsfield units (HU) highlighted in red and region of interest circled in yellow. In this example, LCSCT images were acquired 14 months after the CCT images and the ACCT images were acquired 3 months prior to the CCT images.

