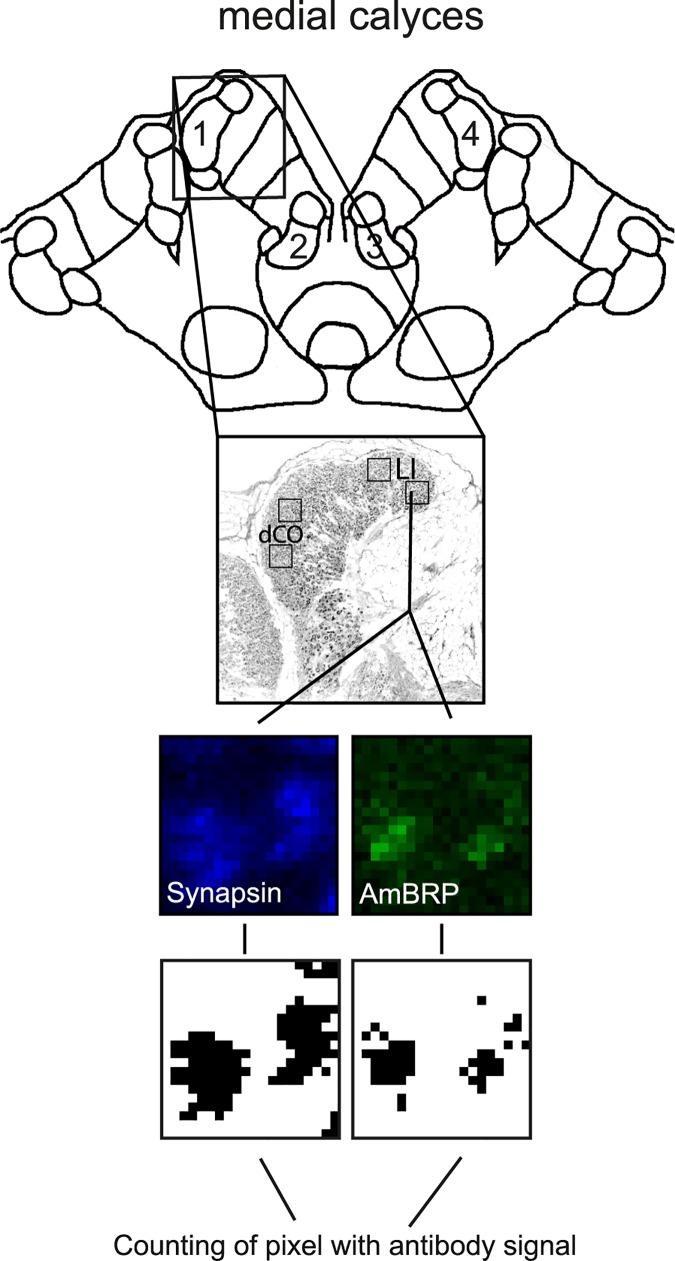
Fig 5. Schematic of the pixel counting method.
Schema presenting the method of counting pixels with an antibody signal in regions of interest (ROIs) located in the medial calyces of the honeybee brain. Black squares in the medial calyx (F-actin labeled, scale bar is 20 μm) show the approximately location of these ROIs. Two ROIs were placed in the lip (LI) and two in the dense collar (dCO). One ROI covers an area of 400 μm2 (86 x 86 pixels). The number of pixels that were positive for a specific antibody (i.e. that had an intensity value over a certain threshold, for details see material and methods) were counted.

