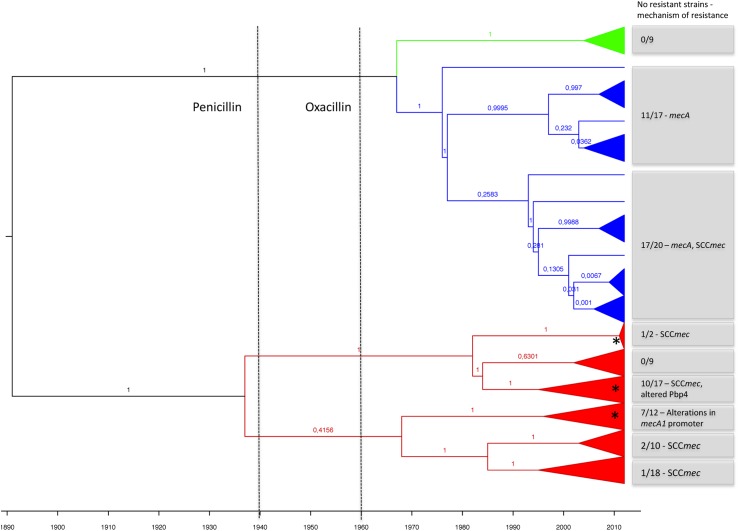
Fig 5. Evolutionary history of mecA homologue alleles.
BEAST analysis of the nucleotide sequence of mecA homologues using the random clock and constant population models. mecA1 alleles are shown in red, mecA alleles are shown in marine blue and mecA2 alleles are shown in green. Numbers next to tree branches are the posteriors for the tree. Dashed lines indicate the time of introduction of penicillin and oxacillin into clinical practice in humans. Grey boxes include the number of resistant isolates within each branch and the associated mechanisms of resistance. Asterisks indicate the clusters in which recombinant mecA1 alleles were identified.

