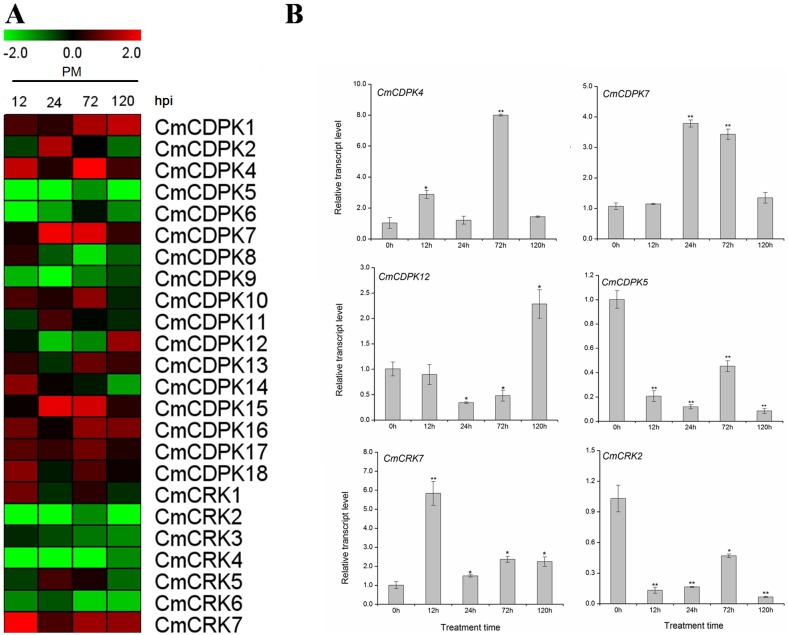
Fig 6. Expression of CDPK and CRK gene in melon following inoculation with P. xanthii by quantitative RT-PCR.
(A) Expression of CmCDPK and CmCRK following inoculation with P. xanthii. The relative transcript level was log2 transformed and visualized as heat map by Mev4.8.1. Gene highly or lowly expressed was colored by red or green, respectively. (B) Detailed expression of selected CmCDPKs and CmCRKs with different expression patterns following P. xanthii inoculation. Means ± standard deviation of three biological replicates each with three technical replicates were plotted as histogram by Origin 9.0. “*,**” significantly differ from the 0 h control at p<0.05 and 0.01, respectively, according to the Student’s test.

