
Fig 5. Time series at stripe-center.
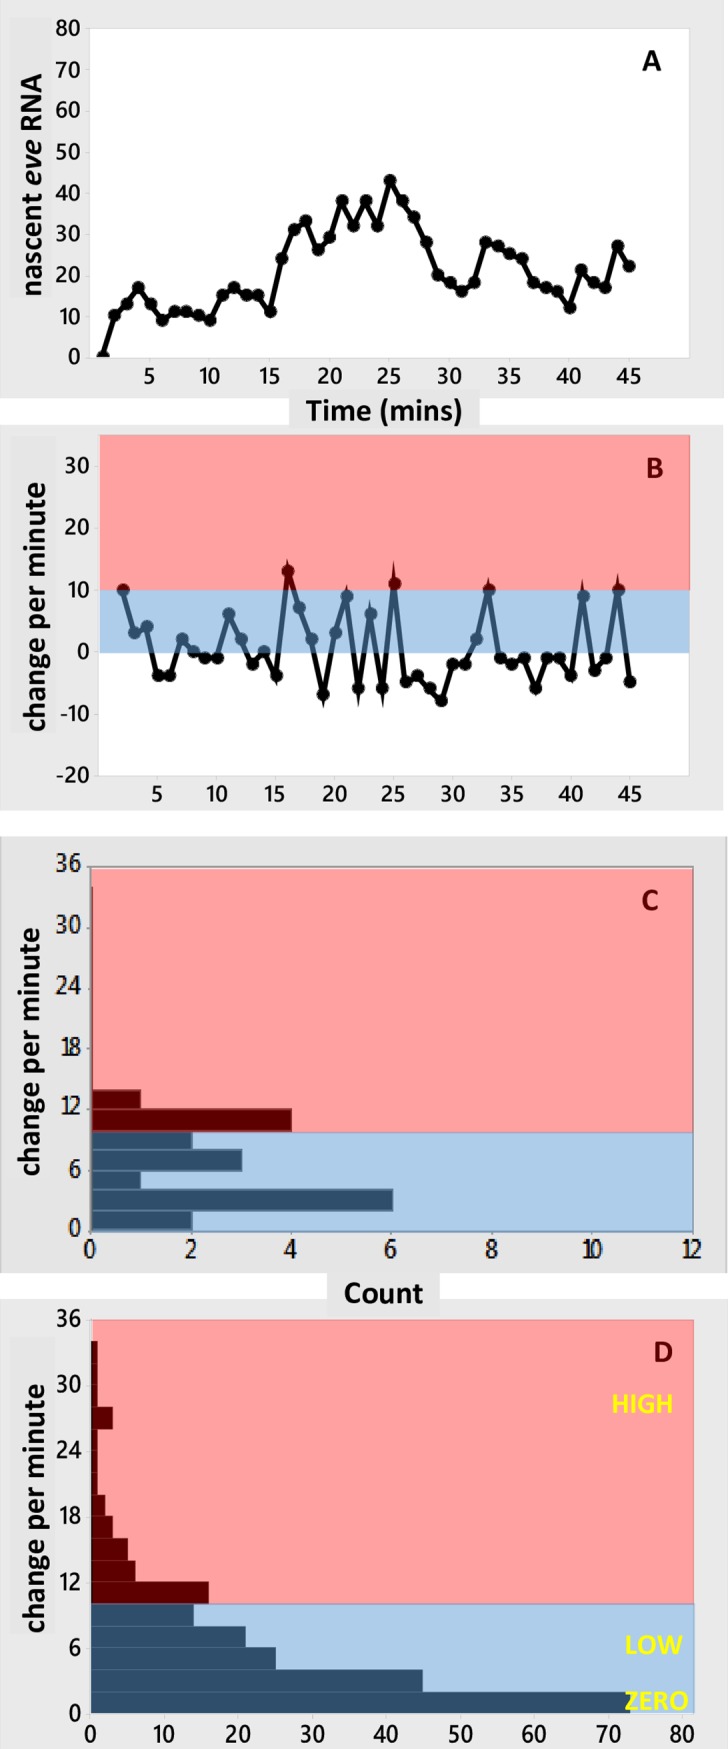
Simulated time series with activation by Bcd (E[1000] state, LOW initiation rate) and Bcd+Hb (E[1100] state, HIGH initiation rate), and no repression (at this position). Same simulation as Fig 4, sampled at the magenta line at 42%EL. (A) Number of nascent transcripts vs. time, generating the bursting seen in the experimental time series (Fig 1B and 1C). (B) Per-minute change vs. time, showing the mixing of high and low initiation intervals. Pink, blue as in Fig 3. (C) Histogram of the per-minute changes. (D) Histogram of per-minute change pooled from 10 replicate simulations (S4 Fig). The steady decrease in frequency with increasing rate in (D), with well-populated low to mid rates (blue), follows the trend in the data (Fig 3E and 3F). HIGH, LOW and ZERO labels correspond to k1100 = 33.5/min, k1000 = 5.4/min, k0000 = 0/min, respectively.