
Fig 8. Test of a simple ON-OFF model, with a single ON transcription state.
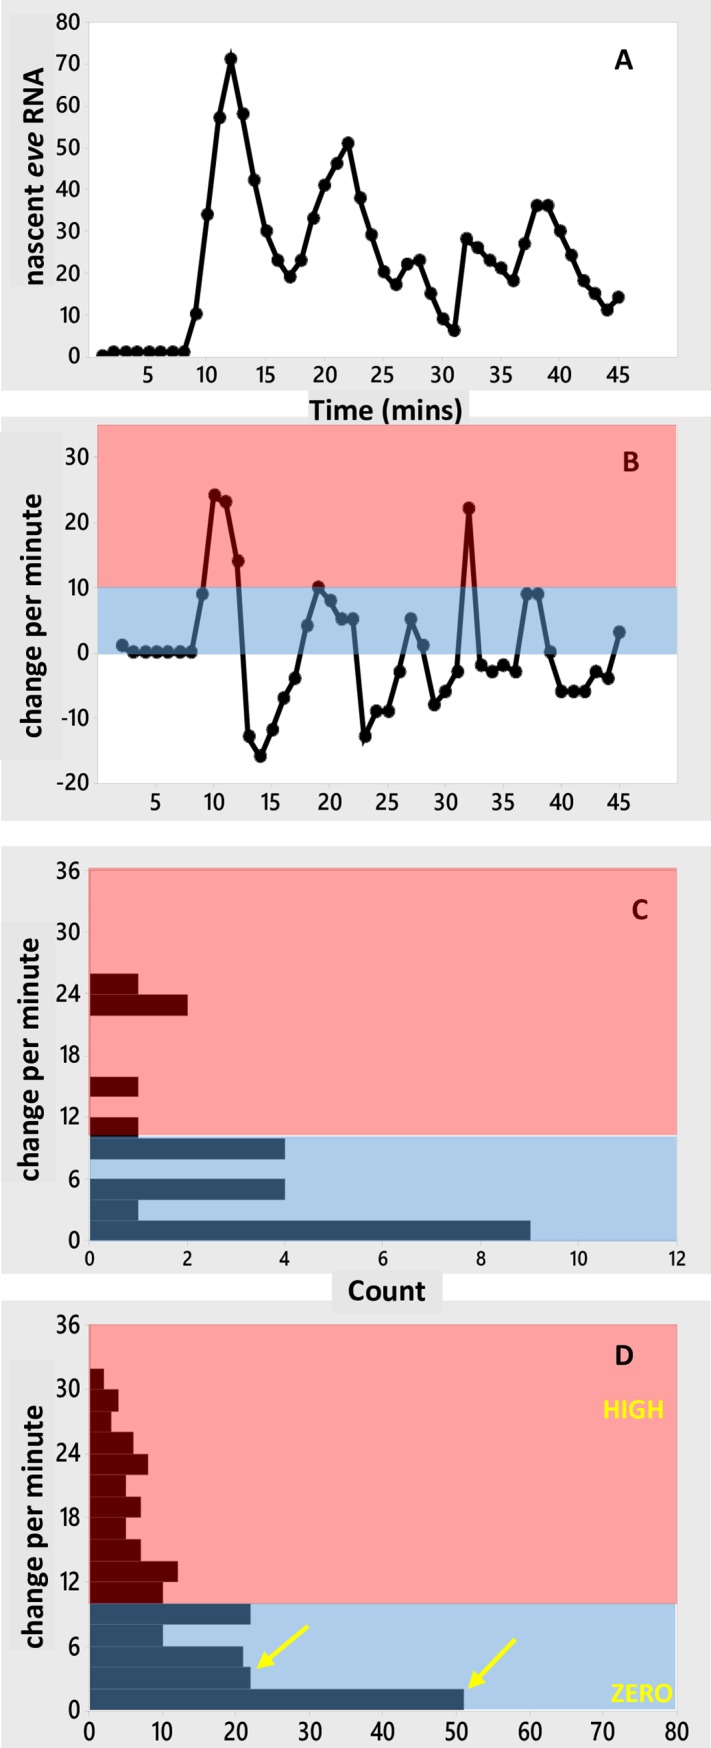
Simulated time series at stripe-center (42%EL) with activation only from the E[1000] state, but producing normal levels of RNA. Fig 7 models LOW rate E[1000] transcription, with reduced RNA levels, for loss of the HIGH rate E[1100] pathway; Fig 8 tests the capacity for a single state, E[1000], to model the experimental time series for the intact eve2 reporter with ON transcription only at the HIGH rate (highest experimentally observed additions per minute, Fig 3A). (A) Number of nascent transcripts vs. time. (B) Per-minute change vs. time. (C) Histogram of per-minute changes. (D) Histogram of per-minute change pooled from 10 such simulations (S7 Fig), showing a sharp drop in count from the near-zero bottom bar (0–1 additions per minute) to the next bar (2–3 additions per minute; see arrows, compare Fig 5D), and a low but broad distribution up to the maximum observed rate. This distribution is due to noise in occupancy of the E[1000] state and transcriptional initiation, not due to multiple ON-state transcription. HIGH, ZERO as in Fig 5. Pink, blue as in Fig 3.